
Discount Analytics
The Analytics tab gives you visibility into how your discounts are performing. Instead of guessing whether a promotion worked, you can see the data.
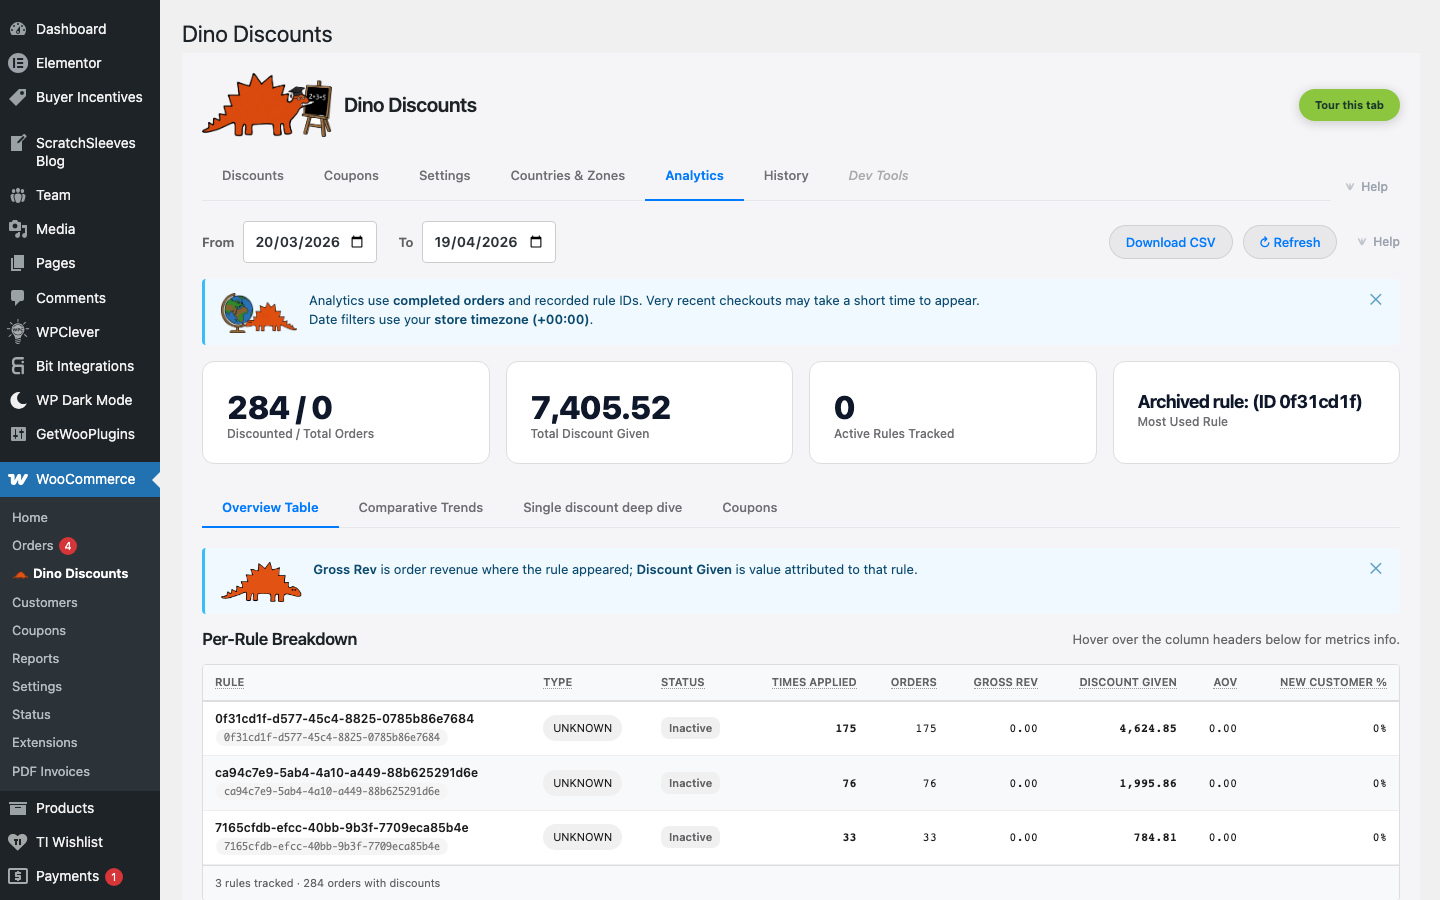
Headline stats
Section titled “Headline stats”The top of the page shows four stat cards at a glance:
| Stat | What it measures | |------|-----------------| | Discounted / Total Orders | How many orders applied at least one discount, against the total order count in range | | Total Discount Given | The summed discount value delivered to customers over the period | | Active Discounts Tracked | How many rules accrued usage in the date range | | Most Used Discount | The single rule that fired most often (only shown when there's data) |
The stat cards update as you change the date range — they're scoped to the From / To pickers at the top of the page.
Four views
Section titled “Four views”The Analytics tab has four sub-tabs, each scoped to the same date range and currency:
Overview Table
Section titled “Overview Table”The default view — headline stats plus the Per-Discount Breakdown sortable table.
The table lists every rule that fired in range with these columns (each header sortable; click to flip direction):
| Column | What it tells you | |--------|------------------| | Discount | The rule name and ID. Archived rules show as "Archived discount: (ID …)" | | Type | The discount mechanism (% off, tiered, BOGO, etc.) | | Status | Whether the rule is currently enabled | | Times Applied | Total redemption count over the period | | Orders | Unique orders containing this discount | | Gross Rev | Total order revenue (before this discount) on orders that used it | | Discount Given | Total discount value attributed to this rule | | AOV | Average order value for carts that used this discount | | New Customer % | Share of redemptions by entirely new customers |
The sort is stable across renders so you can sort by New Customer % to find the discounts pulling first-time orders, then re-sort by Discount Given to see what they cost.
Comparative Trends
Section titled “Comparative Trends”Time-series charts for cross-discount comparison. Pick two or more rules and overlay their redemption / discount-given curves over the date range. Useful for A/B comparisons between two recipes targeting the same audience.
Single discount deep dive
Section titled “Single discount deep dive”Drill-down view for one rule. Picks up the same time-series chart engine as Comparative Trends, plus per-customer cohort breakdowns and an inline timeline of when the rule was created, modified, paused, or republished.
Coupons
Section titled “Coupons”Coupon-specific stats — code redemption rates, bulk-pool usage (codes redeemed vs. codes issued), and per-coupon attribution. This view reads coupon-attribution data captured at checkout, not the rule's raw fire count, so a pooled-code coupon reports against the coupon rather than the underlying rule.
Multi-currency
Section titled “Multi-currency”In a multi-currency store, the Discount Given, Gross Rev, and AOV columns honour the order's checkout currency — the currency-matching gate keeps per-currency totals from blending with FX'd values. The headline Total Discount Given card sums the natively-recorded amounts per currency; the page-level currency context (top-right of the Analytics tab) determines which currency the totals are presented in.
This means the Analytics tab never reports cross-currency totals from FX conversions — only natively-recorded values per checkout currency. See Multi-currency for the per-currency model.
Zone scoping
Section titled “Zone scoping”Per-rule rows in Per-Discount Breakdown reflect the rule's Where does it apply? scope automatically — a rule scoped to "EU zone" only contributes redemptions from orders that resolved to an EU zone at checkout. The zone tree-leaf check used in the analytics path is the same one the engine uses at cart time, so the Analytics tab and the storefront never drift apart on user-role + zone combinations.
Date-range filtering
Section titled “Date-range filtering”Filter by time period to:
- Compare promotional periods — did your Black Friday tiered discount outperform last year's flat one?
- Measure promotion impact — filter to the exact dates a promotion ran
- Track trends — is usage growing over time?
The default range is the last 30 days; pick any custom window using the From / To date inputs.
Independent of the cart hot path
Section titled “Independent of the cart hot path”Analytics data is captured at checkout time (orders are tagged with _dino_rule_id fee items) and queried lazily from the Analytics tab. The dashboard does not add overhead to the rule-evaluation hot path that runs on every cart — opening the Analytics tab queries the orders database directly, the same way WooCommerce's own reports do.
This separation is why analytics queries can be heavy without affecting checkout performance. See Performance Monitoring for the hot-path budget.
Using analytics to optimise
Section titled “Using analytics to optimise”Find underperforming discounts
Section titled “Find underperforming discounts”If a discount has very low Times Applied, consider:
- Lowering the qualification threshold
- Turning on the Spend-more nudge in the Messaging section to guide customers toward it
- Improving the product-page display so shoppers know the deal exists
Measure ROI
Section titled “Measure ROI”Compare Discount Given (your cost) against Gross Rev (revenue on orders that used the discount). A rule that gave away £500 but accrued £5,000 in gross revenue is a 10× return — sort by Gross Rev to surface the volume drivers.
Adjust tiers
Section titled “Adjust tiers”If most customers hit your lowest tier but few reach higher ones, consider:
- Narrowing the gap between tiers
- Tightening the next-tier nudge ("Spend [amount_left] more for [next_tier]")
- Testing a higher first-tier discount with a lower threshold
What's next
Section titled “What's next”- Performance Monitoring — the cart-eval hot-path budget
- Cart Labels — what the customer sees in the cart
- Upsell Messages — nudges that lift the redemption count